| Title: | HYCOM-TSIS GOMb0.04 |
| Resolution: | 1/25º (~4km) |
| Domain: | Extends from 98ºE to 77ºE in longitude and from 18ºN to 32ºN in latitude |
| Vertical resolution: | 41 hybrid layers |
| Atmospheric forcing: | Hourly CFSR and CFSv2 products |
| Lateral boundaries conditions: | Daily means derived from the global HYCOM GOFS 3.1 reanalysis |
| Tidal forcing: | 5 tidal constituents M2,S2,O1,K1,N2 |
| Data assimilation system: | The Tendral Statistical Interpolation (T-SIS) package (Srinivasan et al., 2022) |
| Institution: | Center for Ocean-Atmospheric Prediction Studies (COAPS) |
| Date/Data Range: | 2001-01-01 to 2024-08-31 |
| Experiment Sequence: | expt_02.0 -> expt_03.1 -> expt_03.5 -> ezxpt_03.7 |
| HYCOM version: | 2.3.01 |
| Configuration: | blkdat.input |
| Topography: | regional.depth.[ab], regional.grid.[ab] |
Acknowledgment
We (COAPS and FSU) acknowledge the support from the Bureau of Ocean Energy Management (BOEM) under award number M20AC10020-40. The content is solely the responsibility of the authors and does not necessarily represent the official views of the Bureau of Ocean Energy Management.
Description of the hindcasts:
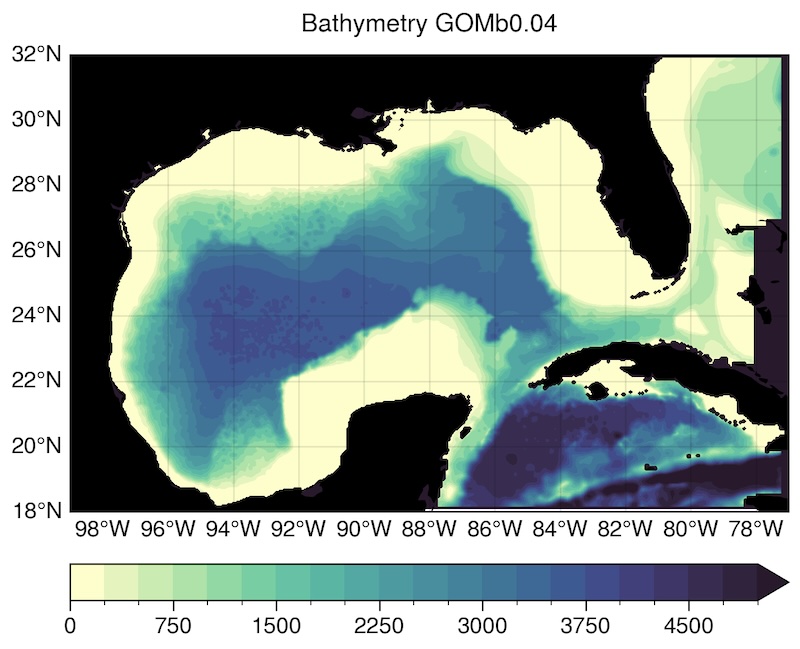
The GOMb0.01 domain is set-up with the high resolution 1km bathymetry of the Gulf of Mexico (Velissariou, 2014) over a domain going from 98ºE to 77ºE in longitude and from 18ºN to 32ºN in latitude. With 41-hybrid layers in the vertical, the latest version of the HYCOM model (2.3.01: github.com/HYCOM/HYCOM-src) is forced at the surface with the CFSR hourly atmospheric forcing from 2001 to 2011 and CFSv2 from 2012 onward. The lateral open boundaries are relaxed to daily means of the global HYCOM GOFS 3.1 reanalysis. Five tidal constituents (M2,S2,O1,K1,N2) are applied at the surface through a local tidal potential and at the boundaries with the Browning-Kreiss boundary conditions. Tidal data are extracted from the Oregon State University (OSU) tidal models: the TPXO9 atlas (Egbert and Erofeeva, 2002).
The GOMb0.04 domain and simulation are based on the same bathymetry as the GOMb0.01 but box-car averaged on the 1/25º grid. Initial conditions, atmospheric forcing and boundary conditions are set-up the same way as in the 1km domain.
The Tendral Statistical Interpolation (T-SIS) package (Srinivasan et al., 2022, www.tendral.com/tsis) is used with HYCOM to produce the hindcast. The basic functionality of the package is a multivariate linear statistical estimation given a predicted ocean state and observations. To optimize the system’s performance for the HYCOM Lagrangian vertical coordinate system, subsurface profile observations are first layerized (re-mapped onto the model hybrid isopycnic-sigma-z vertical coordinate system) prior to assimilation. The analysis procedure then updates each layer separately in a vertically decoupled manner. A layerized version of the Cooper and Haines (1996) procedure is used to adjust model layer thicknesses in the isopycnic-coordinate interior in response to SSH anomaly innovations. Prior to calculating SSH innovations, the mean dynamic topography (MDT) is added back into the altimetry observations. A MDT derived from a 20-year free run of the GOMb0.04 configuration is used for converting SLA to SSH. The multi-scale sequential assimilation scheme is based on a simplified ensemble Kalman Filter (Evensen, 2003; Oke et al., 2002) and is used to combine the observations and the model to produce best estimates of the ocean state at analysis time. This state is then inserted incrementally into HYCOM over 9 hours. The analysis is done daily at 18Z.
Description of the observations used by TSIS:
The TSIS assimilative system accepts SLA, SST and profiles. For these hindcasts, we assimilate remotely sensed SLA and SST as well as in-situ T/S, considered to be the most reliable observations. Along-track SLA from four operational satellite altimeters (T/P, Jason 1,2, Envisat, GFO and Cryosat) constitute the most important data set for constraining the model. The data are available from Collecte Localisation Satellites (CLS) from January 1993 to present. These data are geophysically corrected for tides, inverse barometer, tropospheric, and ionospheric signals (Le Traon and Ogor, 1998; Dorandeu and Le Traon, 1999). For the sea surface temperature, we use the SST (Foundation Temperature) Level 4 product from NAVOCEANO (GHRSST) and NOAA/NODC (AVHRR) which integrates several individual sensors and provides a gridded field with error estimates. ARGO drifters are also used to constrain the sub-surface density structure when available over the hindcast period.
| # | Type | Provider/Source | Frequency | Spatial Characteristics |
|---|---|---|---|---|
| 1 | Sea Level Anomalies | CLS | Daily | Along track |
| 2 | Sea Surface Temperature (Foundation Temperature) | NAVOCEANO, NOAA/NODC | Daily | Gridded |
| 3 | Argo-floats | argo | Daily | Point |
Outputs available:
| Variable | Netcdf variable | Freq. | Resolution | Dimensions |
|---|---|---|---|---|
| Wind (CFSR/CFSv2) | wnd_ewd, wnd_nwd | Hourly | Interpolated to 1/25º | Sea Surface (2d.nc) |
| U and V Velocity | u, v | Hourly | 1/25º | 40 Fixed Levels (3z.nc) |
| Vertical Velocity | w_velocity | Hourly | 1/25º | 40 Fixed Levels (3z.nc) |
| (in-situ) Temperature | water_temp | Hourly | 1/25º | 40 Fixed Levels (3z.nc) |
| Salinity | salinity | Hourly | 1/25º | 40 Fixed Levels (3z.nc) |
| Sea Surface Height | ssh | Hourly | 1/25º | Sea Surface (2d.nc) |
| U and V Barotropic Velocity | u_barotropic_velocity, v_barotropic_velocity | Hourly | 1/25º | Vertical-averaged (2d.nc) |
| Surface Mixed Layer Thickness (dpmixl) | mixed_layer_thickness | Hourly | 1/25º | Sea Surface (2d.nc) |
Experiment numbers:
YYYY: year, DDD: day, HH: hour, NN: Netcdf type (i.e. 2d or 3z) HYCOM-TSIS GOMb0.04: 020_archv.YYYY_DDD_HH_NN.nc: 2001_001_01 to 2017_152_18 031_archv.YYYY_DDD_HH_NN.nc: 2017_152_19 to 2020_366_23 035_archv.YYYY_DDD_HH_NN.nc: 2021_001_00 to 2024_032_18 037_archv.YYYY_DDD_HH_NN.nc: 2024_001_19 to 2024-08-31 |
- Notes expt_03.7:
- Change of bathymetry at Cazumel Channel based on NEMO 1km CICESE; Change of mean dynamic topography (MDT) from model 21-year mean to CNES-CLS 2022.
- Data Correction (2025-07-07):
- Version 2.0 eliminates a frequency peak at 15 days, which was introduced by the interaction between the tides and the assimilation system.
References:
- (Cooper, M., and K. Haines, 1996)
- Altimetric assimilation with water property conservation. J. Geophys. Res.,24, 1059–1077.
- (Dorandeu, J., and P. Y. Le Traon, 1999)
- Effects of global mean atmospheric pressure variations on mean sea level changes from TOPEX/Poseidon. Journal of Atmos. and Ocean. Techn., 16.9, 1279-1283.
- (Egbert, Gary D., and Svetlana Y. Erofeeva, 2022)
- Efficient inverse modeling of barotropic ocean tides. Journal of Atmos. and Ocean. Techn., 19.2, 183-204.
- (Evensen, G., 2003)
- The ensemble kalman filter: Theoretical formulation and practical implementation. Ocean Dyn., 53, 343—367.
- (Le Traon, P. Y. and Ogor, F., 1998)
- ERS-1/2 orbit improvement using T/P: The 2 cm challenge, J. Geophys. Res., 103, 8045–8057.
- (Oke, P. R., Allen, J. S., Miller, R. N., Egbert, G. D., Kosro, P. M., 2002)
- Assimilation of surface velocity data into a primitive equation coastal ocean model. J. Geophys. Res. , 107, doi:10.1029/2000JC000511.
- (Srinivasan, A., T.M. Chin, E.P. Chassignet, M. Iskandarani, and N. Groves, 2022)
- A statistical interpolation code for ocean analysis and forecasting. J. Atmos. Oce. Tech., 39(3), 367-386, doi:10.1175/JTECH-D-21-0033.1.
- (Velissariou, Panagiotis. 2014)
- Gulf of Mexico High-Resolution (0.01° x 0.01°) Bathymetric Grid - Version 2.0, February 2013. Distributed by: Gulf of Mexico Research Initiative Information and Data Cooperative (GRIIDC), Harte Research Institute, Texas A&M University–Corpus Christi. doi:10.7266/N7X63JZ5